We’re putting the data on the map
A toxic soup of oil and chemical spills is polluting UK seas every day. Our map uses information uploaded directly from the government’s database, reported by the oil and gas industry itself, to expose the truth: ocean life is suffering. Take a look. Take a breath. Then take action.
Total
Spills
0
0KG
Oil Released
0KG
Chemicals Released
0KG
In Protected Areas
In the last 12 months
Spills in marine
protected areas
Largest recorded
Oil spill
4,994kg
Largest recorded
Chemical spill
759kg
Actually, it’s even worse than it looks
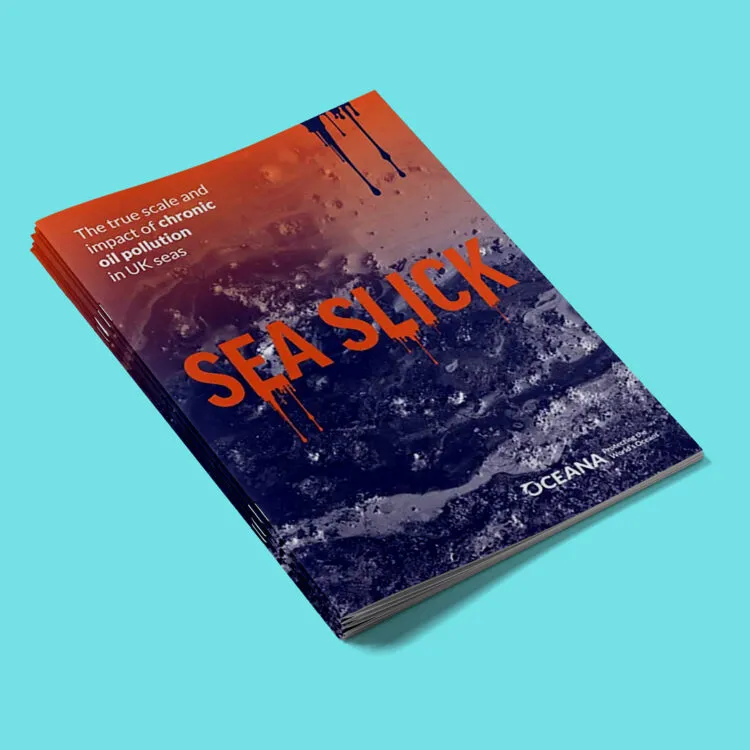
Oil and gas companies get permits for pumping a dirty by-product called ‘produced water’ into our ocean. This is contaminated with oil and other chemicals. We can’t add this low-level (but legal) toxic drip feed to the map. Nor can we show you the true extent of the pollution whilst data is missing. Oceana’s Sea Slick report found that around a third – 32% – of recorded permit breaches failed to include the volume of oil discharged.
View Report
Why do some spills look weird?
The data in the map is uploaded directly from the government’s integrated reporting service on a weekly basis, and includes any errors or mistakes in their reporting. We take no responsibility for inaccuracies or errors. Data on marine protected areas comes from the JNCC.